Key Takeaways
- Advanced Micro Devices shares rose Tuesday morning after soaring yesterday to a 19-month high on news that the chip designer and ChatGPT maker OpenAI have inked a multi-year supply deal.
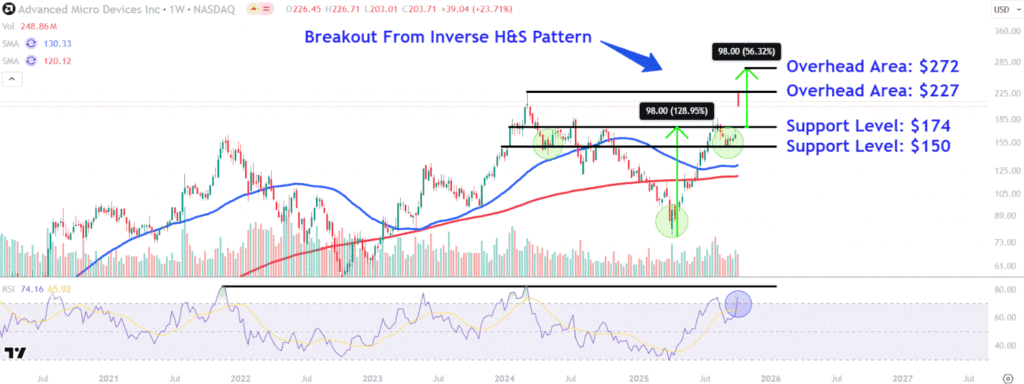
- The stock staged a dramatic breakout from an inverse head and shoulders pattern on Monday, laying the groundwork for follow-through buying.
- Investors should watch critical overhead areas on AMD’s chart around $227 and $272, while also monitoring support levels near $174 and $150.
Advanced Micro Devices (AMD) shares rose Tuesday after soaring yesterday to a 19-month high on news that the chip designer and ChatGPT maker OpenAI have inked a multi-year supply deal.
Under the agreement, OpenAI is committing to buying several generations of AI chips from AMD in a long-term deal that could see it take a 10% stake in the Nvidia (NVDA) rival. AMD said it anticipates the ripple effect of the deal to net it more than $100 billion in new revenue over four years from OpenAI and other customers.
AMD shares, which jumped 24% on Monday, were up more than 5% at around $215 in recent trading, putting the stock on pace for a record closing high. The stock is up 77% since the start of the year, handily outpacing Nvidia’s 40% return over the same period.
Below, we take a closer look at AMD’s weekly chart and apply technical analysis to identify critical price levels worth watching out for.
Inverse Head and Shoulders Breakout
AMD shares staged a dramatic breakout from an inverse head and shoulders pattern on Monday, laying the groundwork for follow-through buying.
While the surge coincided with the relative strength index crossing into overbought territory, the indicator remains below peaks that preceded drawdowns in November 2021 and March 2024. However, the stock closed near its low for the day yesterday, indicating a short-term over-extension.
Let’s point out two critical overhead areas to watch on AMD’s chart if the shares continue their bullish run and also identify support levels worth monitoring during potential pullbacks.
Critical Overhead Areas to Watch
If the chipmaker’s shares regain their upward momentum, investors should initially keep track of the $227 area. This location on the chart would likely attract significant attention near Monday’s high, which coincidently sits just below the stock’s record intraday high set in March last year.
Investors can project an overhead area to watch above the stock’s all-time high by using the measuring principle, a technique that analyzes chart patterns to forecast future price movements.
When applying the study to AMD’s chart, we calculate the distance from the inverse head and shoulders’ head to neckline in points and add that amount to the pattern’s neckline. For example, adding $98 to $174 projects a bullish target of $272, about 34% above Monday’s closing price.
Support Levels Worth Monitoring
During retracements, it’s worth watching for a potential fill of yesterday’s stock gap down to around $174. Investors would likely see this as a high probability buying area near the inverse head and shoulders’ neckline, which could flip from prior resistance to future support.
Finally, a steeper pullback would open the door to a retest of the $150 level. This area on the chart could provide support near the inverse head and shoulders’ two shoulders, which closely align with the December 2023 high.
The comments, opinions, and analyses expressed on Investopedia are for informational purposes only. Read our warranty and liability disclaimer for more info.
As of the date this article was written, the author does not own any of the above securities.

